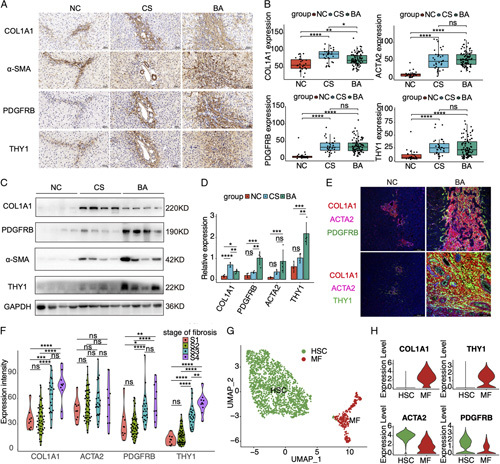
FIGURE 5.

The expressions of THY1 and fibrotic markers, and their correlations with liver fibrosis in biliary atresia. (A) Immunohistochemistry analyses of the THY1 and fibrotic markers in the liver of normal control (NC), cholestasis (CS), and biliary atresia (BA). The images were captured at the same field of microscope. (B) The H-scores of immunohistochemistry analyses in the liver tissue microarray including 93 cases of BA, 30 cases of NC, and 34 cases of CS. (C) Western blot results of THY1 and fibrotic markers in BA and controls. (D) Statistic analysis of western blot results in (C). (E) Immunofluorescence staining of THY1 and fibrotic markers in BA and controls. (F) The expression levels of THY1 and fibrotic markers in BA patients with different stage of fibrosis. (G) UMAP plot of HSCs and myofibroblasts (MFs) in the scRNA dataset of GSE136103. (H) The expression levels of THY1 and fibrotic markers in the HSCs and MFs of GSE136103. *p < 0.05, **p < 0.01, ***p < 0.001, ****p < 0.0001, ns: not significant.
