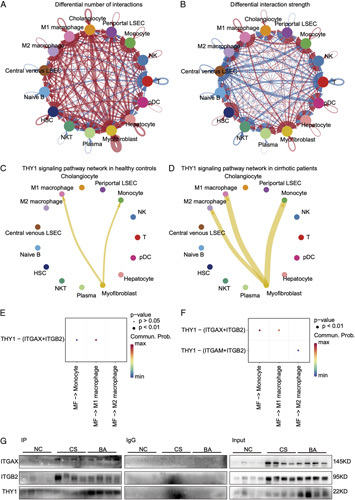
FIGURE 7.

THY1 may exert roles in cholestatic fibrosis by interacting with integrins on myeloid. (A) Differential number of interactions in the cell-cell communication network between cirrhosis and healthy controls in GSE136103. (B) Differential strength of interactions in the cell-cell communication network between cirrhosis and healthy controls in GSE136103. In the chord diagram, the arrow pointed cells represent reveiving cells, while cells on the other side stand for the sending cells. Red colored edges represent increased signaling in cirrhosis, whereas blue colored edges represent decreased signaling in cirrhosis. Furthermore, the line width is proportional to the number and strength of interactions. (C) THY1 signaling pathway network in healthy controls. (D) THY1 signaling pathway network in cirrhotic patients. (E) Heatmap of ligand-receptor interactions in THY1 signaling pathway network in healthy controls. (F) Heatmap of ligand-receptor interactions in THY1 signaling pathway network in cirrhotic patients. (G) Co-immunoprecipitation of ITGAX and ITGB2 by targeting THY1 in BA and controls (NC, CS). Abbreviations: CS, cholestasis; NC, normal control.
