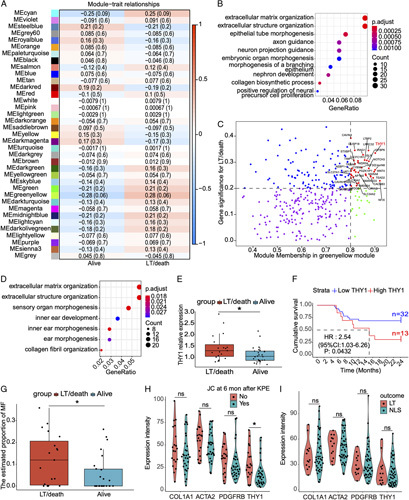
FIGURE 8.

THY1 is correlated with the prognosis of BA. (A) Weighted correlation network analysis showing the heatmap of correlations between 37 modules and clinical trait (alive and LT/death) in GSE15235. (B) Gene Ontology (GO) analysis of genes in the greenyellow module. (C) LT/death-related hub genes showing a high correlation with the module (r > 0.8) and clinical phenotype (r > 0.2). (D) GO analysis of upregulated genes in BA patients with LT/death. (E) THY1 expression levels in BA patients with NLS or not. (F) The NLS survival curve of BA patients with higher and lower level of THY1 expressions. (G) Deconvolution analysis demonstrated the estimated proportion of myofibroblasts between BA patients with NLS and LT/death in GSE15235 using the single cell reference data GSE136103. (H) Immunohistochemistry analyses of the THY1 and fibrotic markers in BA patients with JC or not at 6 months after Kasai portoenterostomy (KPE). (I) Immunohistochemistry analyses of the THY1 and fibrotic markers in BA patients with NLS or not at 2 years after KPE. *p < 0.05, ns: not significant. Abbreviations: BA, biliary atresia; LT, liver transplantation; NLS, native liver survival.
