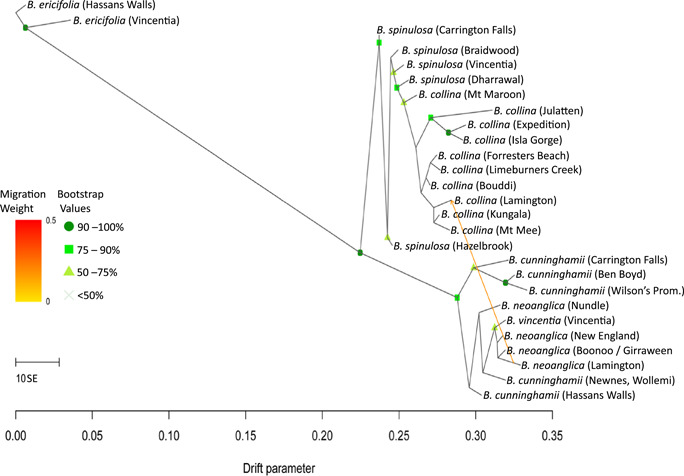
Figure 4.

TreeMix maximum likelihood tree of the relationships among representative populations of the hairpin banksia complex indicating one migration event and its direction between sympatric species at the Lamington site. Migration events are modelled for populations that do not fit well into the bifurcating tree model, because they have ancestry from multiple parental populations, and they are indicated as edges. The number of migration events presented is based on an examination of the progressive improvement in fit (Appendix S18). The color of the edges reflects the relative weight of migration, i.e., the fraction of alleles in the descendant population that originated in each parental population (m = 0 → 1, yellow: small fraction of alleles, red: large fraction). Bootstrap support values below 50% are not reported. Refer to Appendix S1 for detailed locality data.
