
Figure 2.
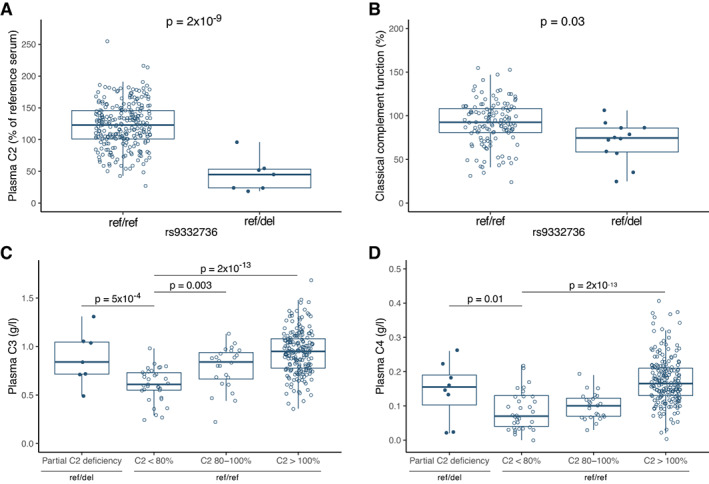
Concentration of plasma complement components in systemic lupus erythematosus (SLE) patients with the 28‐bp C2 deletion rs9332736 (ref/del) and in SLE patients with normal C2 (ref/ref), including plasma C2 concentration relative to a reference serum (n = 261) (A), classical complement function (n = 140) (B), plasma C3 (C) and plasma C4 (D) concentration stratified by presence of the 28‐bp C2 deletion rs9332736 and plasma C2 concentration (n = 258 for C and D). Data were analyzed by analysis of variance and adjusted for sex and age at sampling (A, C, and D), and for copy number of C4A and C4B (B). Plasma concentration of C4 was square root transformed. Data are shown as box plots. Each box represents the 25th to 75th percentiles. Lines inside the boxes represent the median, and whiskers extend to 1.5 times the interquartile range. Solid circles represent individual SLE patients heterozygous for rs9332736; open circles represent individual SLE patients with normal C2. Color figure can be viewed in the online issue, which is available at http://onlinelibrary.wiley.com/doi/10.1002/art.42270/abstract.