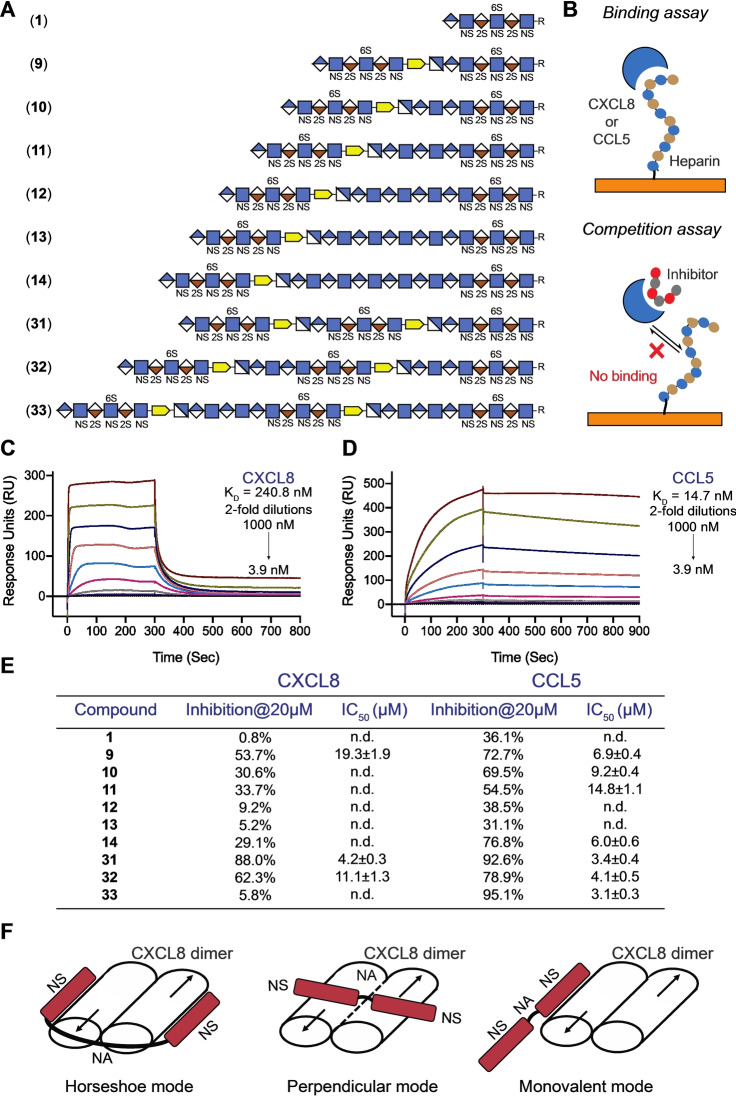
Figure 4.
Surface Plasmon Resonance (SPR) binding assay and SPR competition inhibition assay. A) Symbol structures of HS domain compounds employed in SPR competition inhibition assay, where R=O(CH2)5NH2. B) Binding assay using a streptavidin‐coated sensor chip on which biotinylated heparin was immobilized, CXCL8 or CCL5 as analyte at different concentrations. Competition assay was performed by premixing HS mimetics with CXCL8 or CCL5 followed by flowing the mixtures over the heparin modified sensor chip and monitoring the response units. C) and D) SPR sensorgrams representing the concentration‐dependent kinetic analysis of the binding of immobilized heparin with CXCL8 (C) and CCL5 (D). Data were analyzed using Biacore T100 evaluation software. For steady state affinity analysis, fitting curves and detailed binding parameters see Supporting Information Figures S3 and S4. E) SPR‐based competition assay. Maximum inhibition observed (at 20 μM) and half‐maximal inhibitory concentration (IC50) values of domain structures for CXCL8 and CCL5 binding to heparin functionalized surfaces. For individual inhibition curve see Supporting Information Figures S5 and S6. Data are presented as mean ±SEM (n=3), all experiments were performed three times at the minimum. n.d.: not determined. F) Different binding modes of CXCL8.

