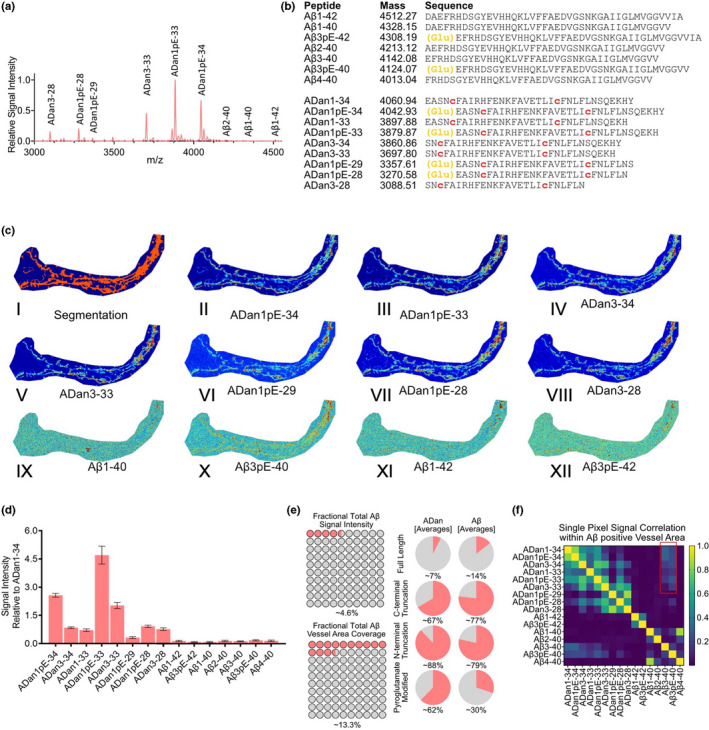
FIGURE 3.

MALDI MSI of CAA in familial Danish dementia (FDD). (a) Average mass spectra of vessels from occipital cortex(blue) and frontal cortex(red) in FDD patient. (b) List of peptides identified through LC–MS‐based analysis of laser micro‐dissected vessels. Similarly, to FBD case, the FDD patient displayed prominent N‐terminal pyroglutamate formation (orange letters), as well as the presence of disulfide bridges between the two cysteine residues in the ADan sequence (red letters). The FDD patient displayed the presence of both ADan but also Aβ peptides (c.I) spatial segmentation by k‐means clustering allowed for the identification of amyloid‐positive vessel. (c.II–VIII) single ion images of ADan peptides that contributed to the clustering, demonstrated a distinct distribution as compared to (c.IX–XII) the Aβ peptides present in the vessels. (d) Bar plot representing signal intensity of each of the peptides, relatively to the full‐length, unmodified ADan1‐34 peptide, extracted from 50 to 100 individual vessels in both brain regions. Error bars indicate SD. (e) Plot representing fractional contribution of all Aβ peptides to the total amyloid signal intensity within vessel area (top) and fractional coverage of all the amyloid vessel area by all Aβ peptides (bottom). (e) Fractional content of full‐length, C‐terminally truncated, N‐terminally truncated, and pyroglutamate modified isoforms among detected peptides in FDD patients. ADan peptides appear to be much more often N‐terminally modified, with the presence of nearly double as many pyroglutamate‐modified peptides as compared to Aβ. (f). Heatmap representing single pixel correlation of signal intensity between individual amyloid species. The strongest correlation between ADan peptides and Aβ peptides was observed for the Aβ3‐40 and Aβ3pE‐40 peptides
