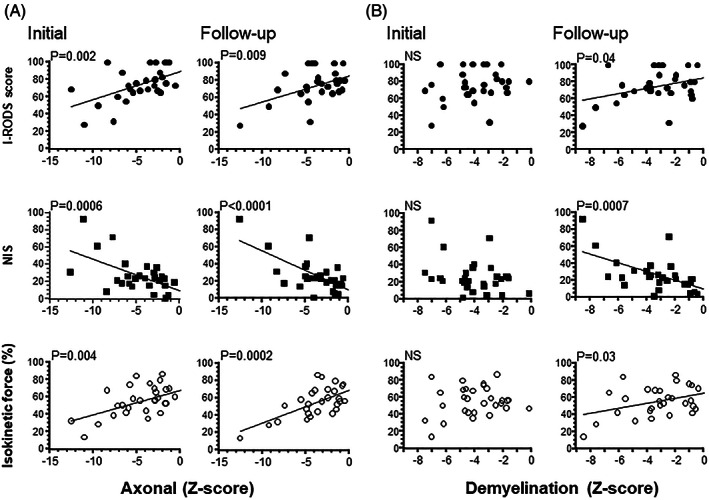
FIGURE 1.

Univariate regression analysis of the follow‐up clinical scores vs the axonal and demyelination Z scores at the initial and follow‐up examinations. Univariate regression analysis of the initial axonal and follow‐up axonal Z scores (A) and initial and follow‐up demyelination Z scores (B) and follow‐up Inflammatory Rasch‐built Overall Disability Scale (I‐RODS), neuropathy impairment score (NIS), and isokinetic strength (%). At the initial axonal Z scores, the correlations were highly significant (P = .0006 to .004) as they were at the follow‐up axonal Z scores (P < .0001 to .009). By contrast, the relationships between clinical scores and demyelination Z scores were only significant at follow‐up (P = .0007 to .04).
