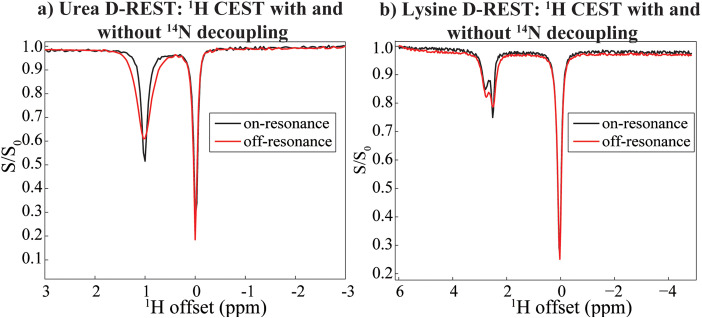
Figure 8.
D‐REST experiments detecting a low‐γ 14N nucleus on the abundant 1H signal of water (set to 0 ppm). a) Comparison of on‐ and off‐resonance CW decoupling on the CEST spectral mapping of a 200 mM urea sample at pH=7.1; an RF field of 10 Hz was applied for 1 s for the proton saturation. The on and off experiments involved 14N decoupling at 0 and at 450 ppm from the urea 14N resonance, respectively. b) Idem for a 1 M lysine sample at pH 2.0, with a proton ω1 of 10 Hz applied for 1 s for saturation, and 14N decoupling applied at 21 and 471 ppm for the on/off experiments (lysine's 14Nϵ resonating was the only one identified at 20.6 ppm) All experiments were performed at 7 T and 24 °C and employed decoupling nutation fields of 1.4 kHz, 1 scan per 1H offset, and a 1H offset incremented in 0.1 ppm steps.

