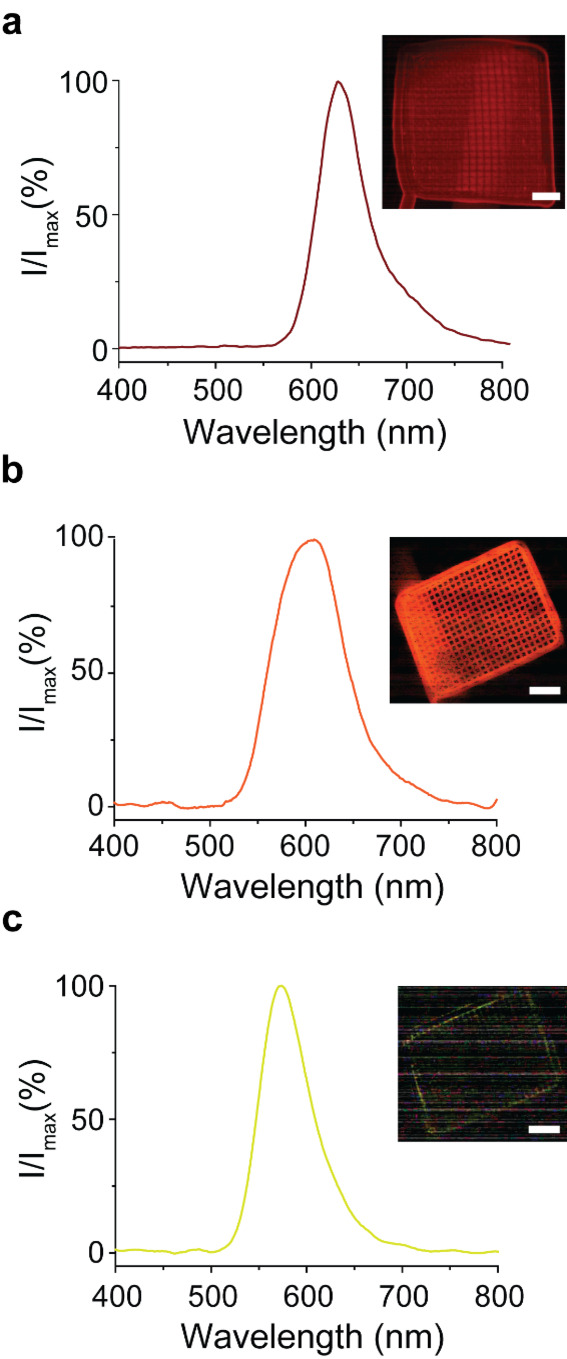
Figure 3.

Spectral tuning of the electrochemically induced AMP‐luc luminescence. Normalized emission spectra acquired by applying a constant negative bias (−2.0 V vs Ag/AgCl) to a platinum mesh working electrode (pictured in figure) in contact with a 0.43×10⁻³ M solution of AMP‐luc. The electrolyte was a) 2.0×10⁻¹ M Bu4NClO4 in DMSO, b) 2.0×10⁻¹ M LiClO4 in THF, and c) 5.0×10⁻³ M LiClO4 in THF. The peaks maximums are progressively blue‐shifted [626 nm (a), 605 nm (b), and 573 nm (c)]. Scale bars in the optical image insets are 1.0 mm.
