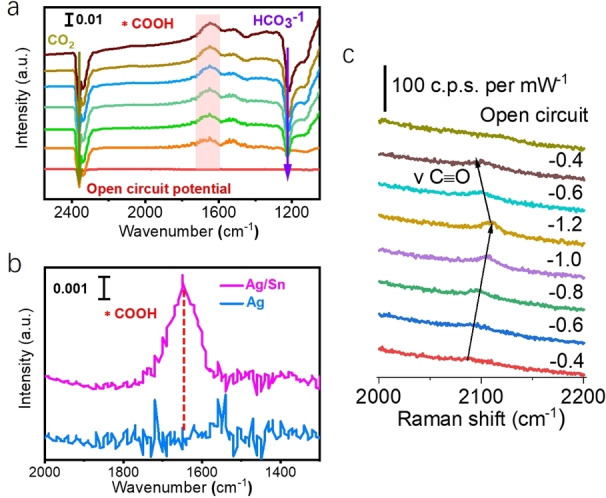
Figure 5.

In situ experiments. a) In situ ATR‐IR spectroscopy on Ag/Sn in CO2 0.1 M KHCO3 electrolyte at different potentials and 20 min after CO2 purged in the cell. b) Comparison of in situ ATR‐IR spectra of Ag/Sn and Ag at −0.5 V vs. RHE in the range of 1300–2000 cm−1. c) In situ Raman spectrum of Ag/Sn during CO2RR.
