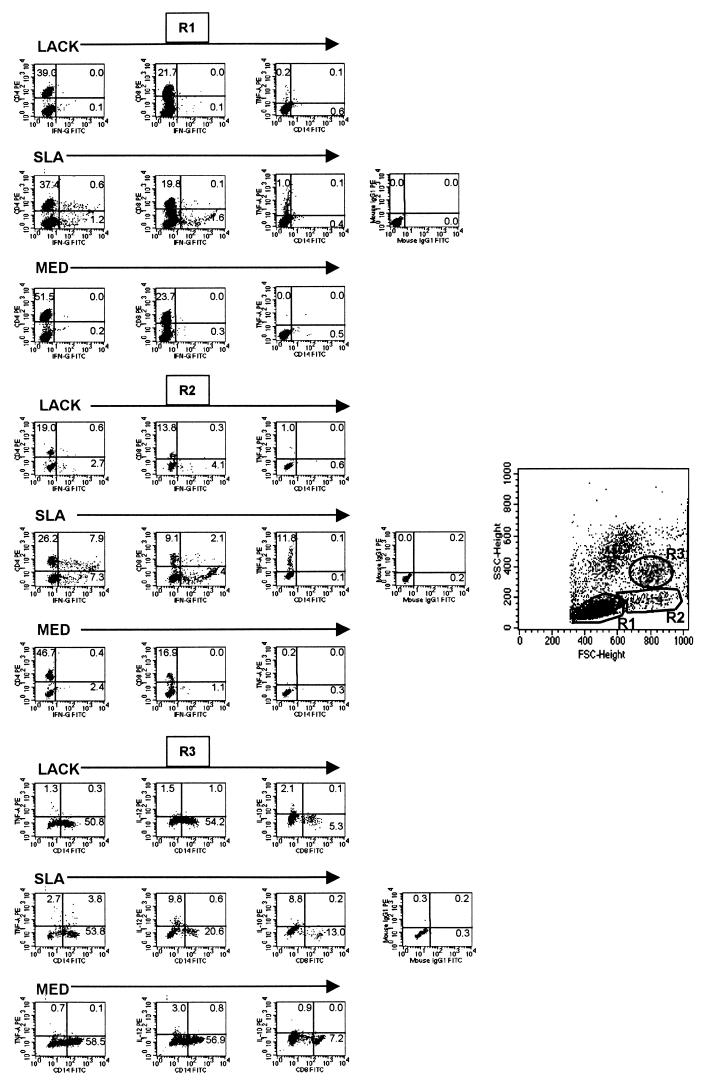
FIG. 1.
Representative histograms from human patients with cutaneous leishmaniasis. Each group shows the frequency of cytokine-producing cells after 20 h of culture with LACK, SLA, or medium alone in R1, R2, or R3. The histograms demonstrate the frequencies of cells expressing the indicated molecules as detected using antibodies directly conjugated with either PE (y axis) or FITC (x axis) as described in Materials and Methods. The forward- and side-scatter histograms demonstrate the placement of R1 (small lymphocytes), R2 (blast lymphocytes), and R3 (monocytes/macrophages).

