FIG. 5.
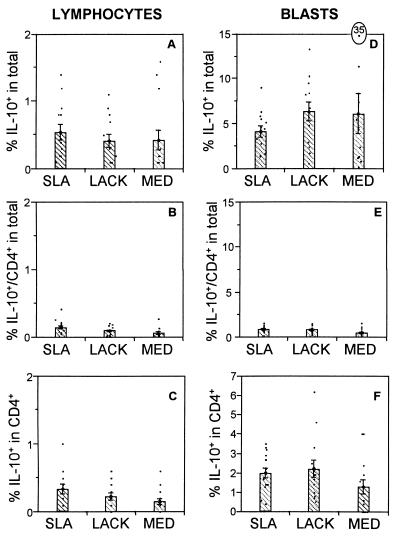
The frequencies of IL-10-producing cells are equivalent among the various stimuli. The first column represents data obtained from the small lymphocyte gate, R1 (Fig. 1). (A) Percentage of lymphocytes producing IL-10 in the whole population; (B) percentage of CD4+ IL-10+-producing T cells in the whole population; (C) percentage of IL-10+-producing cells within the CD4+ population. The second column represents data obtained from the lymphocyte blast gate, R2 (as shown in figure 1). (D) Percentage of lymphocytes producing IL-10 in the whole population; (E) percentage of CD4+ IL-10-producing T cells in the whole population; (F) percentage of IL-10-producing cells within the CD4+population. Data are the means ± standard errors for 13 individual patients with cutaneous leishmaniasis. The frequency of positive cells was determined using intracellular cytoplasmic staining of cytokines in conjunction with cell surface markers followed by using flow cytometry analysis. The antibodies used were anti-CD4–FITC and anti-IL-10–PE. The means were compared using the statistical program JMP, and Student's t test; comparison of all pairs was made with a P value of <0.05. In all cases, there were no significant differences among the stimuli.

