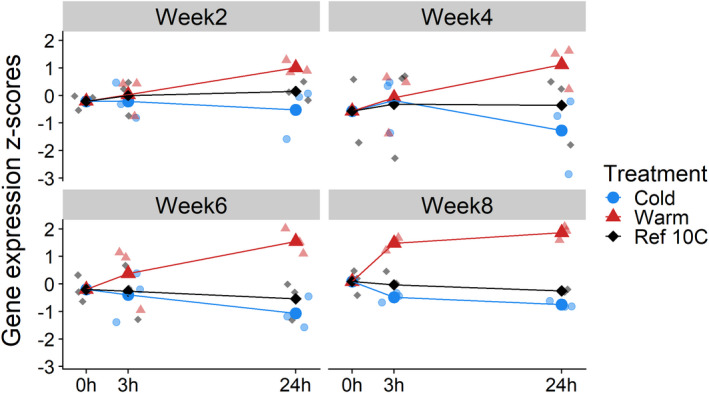
FIGURE 5.

Gene expression profile of circadian clock gene period. After taking an RNA sample at time point 0 h from eggs at constant 10°C (black points), eggs from each clutch (N = 3 clutches per development week) were transferred to a warmer (red points, 15°C) or colder temperature (blue points, 5°C) and RNA was sampled at 3 and 24 h after the transfer (in total, N = 7 samples per clutch). Average, vst normalized and z‐transformed gene expression counts are shown for each development week (bold points and lines), showing that the circadian clock gene period is consistently upregulated after 24 h of warmth (log2FC = 0.85, FDR <0.001), and consistently downregulated after 24 h of cold (log2FC = −0.36, FDR = 0.001, Table S4.2, GeneID = MSTRG.9278)
