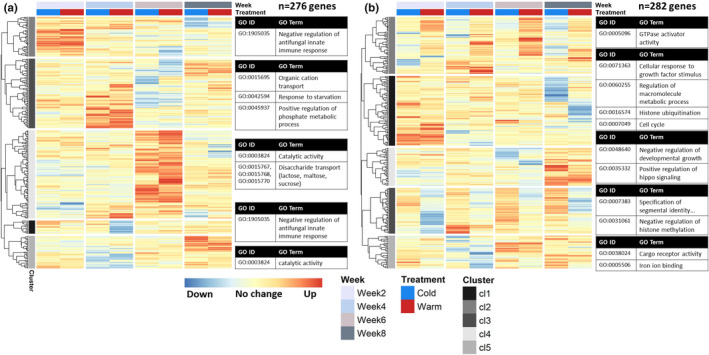
FIGURE 6.

Gene expression clusters of temperature‐responsive genes with a significant within‐week treatment effect, after 3 h (a) and after 24 h (b). Genes included in the figure responded significantly to a 5°C increase and/or decrease in temperature compared to the control constant 10°C in one or more developmental weeks (N = 48 samples per panel), capturing genes that mostly showed week‐specific responses. For each heat map, columns correspond to the four development weeks sampled, and rows correspond to vst normalized and z‐transformed expression counts of each included gene, showing the difference in expression from 0 to 3 h (panel a, DEGs = 276 genes) or 0 to 24 h (panel b, DEGs = 282 genes) compared to the control, for the cold (blue column) and warm (red column) treatments. See Table S4.3 for included genes and corresponding statistics. For each identified gene expression profile cluster (indicated by grey scale bands on the left of each heatmap), the most significant GO terms are given (p < .01), with number of terms shown depending on the size of the cluster. For overview, the shown GO terms belong to different parent terms and very specific GO terms have been substituted for their parent term. See Table S6 for a complete list of overrepresented GO terms for each gene expression cluster
