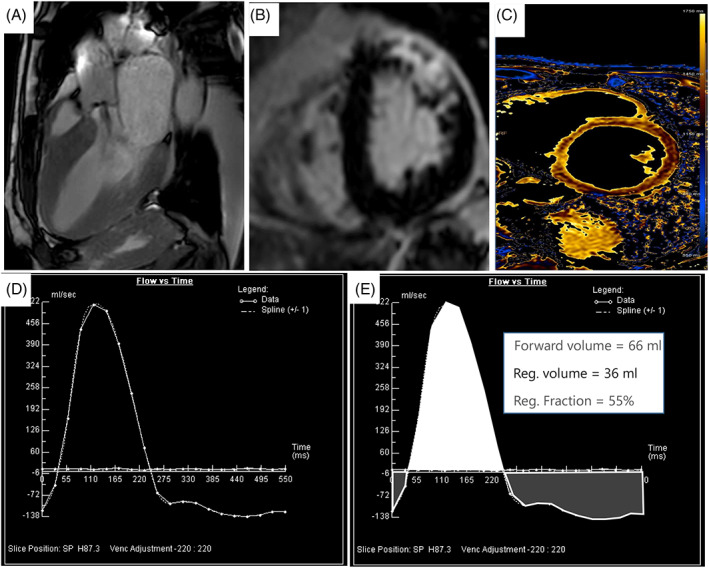
FIGURE 2.

Cardiac magnetic resonance assessment of aortic regurgitation: (A) Visualization of a “jet” (hypointense signal due to phase loss of proton spin due to turbulent flow) of aortic insufficiency with a cine‐SSFP sequence; (B) late gadolinium enhancement sequence showing an intramyocardial enhancement of the anterior and antero‐lateral wall of the left ventricle. (C) Native T1 mapping to assess the presence of interstitial fibrosis, (D) flow/time curve phase contrast derived: positive values refer to forward flow while negative values indicate backward (regurgitant) flow, (E) example of measurement of regurgitant volume (Reg. volume) and regurgitant fraction (Reg. fraction) using flow/time curve phase contrast derived. SSFP, steady state free precession
