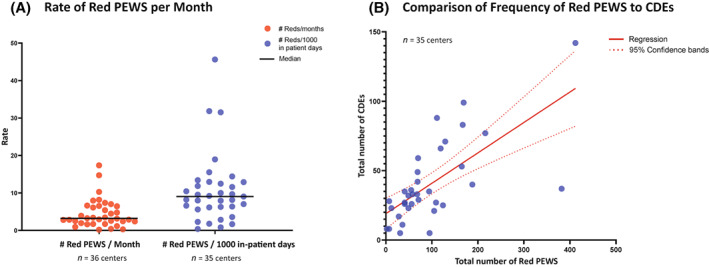
FIGURE 4.

The frequency of red PEWS scores (≥5). Graphs describe the total number of documented red PEWS at Proyecto EVAT centers from the start of the PEWS pilot through October 2021 (or until 18 months after implementation), with 10–30 months of data per center. Red PEWS scores, defined as scores ≥5, were documented by local PEWS implementation leadership teams through a prospective quality‐improvement registry from the start of the PEWS pilot. Monthly numbers of in‐patient hospital days and clinical deterioration events, defined as an unplanned ICU transfer, the use of ICU interventions on the wards, or nonpalliative ward death, were also documented by all centers for the same period. One center was not able to share patient‐level data because of national regulations but collected these data locally for quality improvement (resulting in n = 35 centers for some measures, as labeled in the illustration). Each dot represents data from one center with: (A) the average number of red PEWS per month (red) and the rate of red PEWS normalized to 1000 in‐patient days at each center (blue), with the black line representing the median among all centers; and (B) a comparison of the total number of red PEWS (x‐axis) and CDEs (y‐axis) at each center during the same period, with a solid red line indicating regression and the dotted red lines indicating the 95% confidence interval. CDEs indicates clinical deterioration events; ICU, intensive care unit; PEWS, pediatric early warning systems; Proyecto EVAT, the Early Warning Assessment Scale Project.
