FIGURE 1.

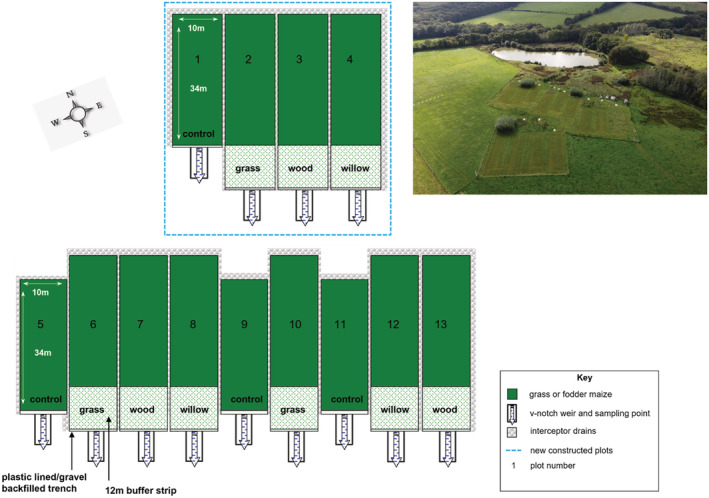
Schematic of the experimental platform and aerial photograph of the experimental facility, showing the replicated buffer plots.

Schematic of the experimental platform and aerial photograph of the experimental facility, showing the replicated buffer plots.