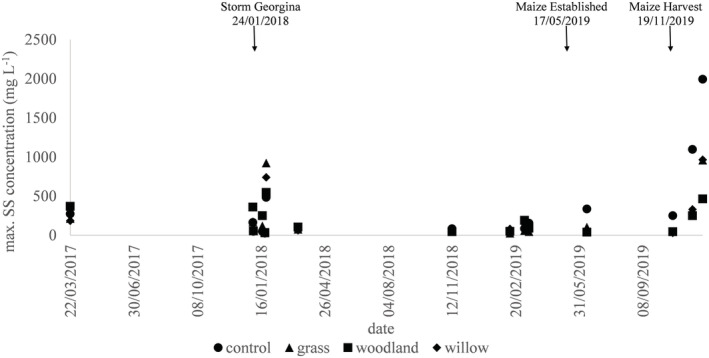
FIGURE 3.

Maximum suspended sediment (SS) concentration (mg L−1) for each rainfall event for the control ( ), grass buffers (
 ), woodland buffers (
 ) and willow buffers (
 ).
).

Maximum suspended sediment (SS) concentration (mg L−1) for each rainfall event for the control ( ), grass buffers (
 ), woodland buffers (
 ) and willow buffers (
 ).
).