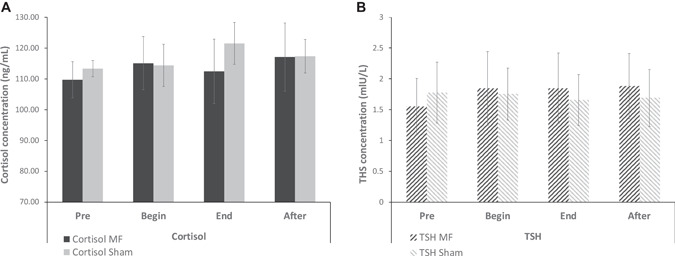
Fig. 3.

A: Mean cortisol levels of the five healthy participants in each exposure conditions. The error bars represent the Standard Error of the Mean. B: Mean TSH levels of the five healthy participants in each condition. The error bars represent the Standard Error of the Mean. Pre: before the exposure, at 7 min (after the beginning of the experimental session); Begin: during the exposure, at 12 min; End: during the exposure, at 17 min; After: after the exposure, at 27 min). TSH, Thyroid‐stimulating hormone.
