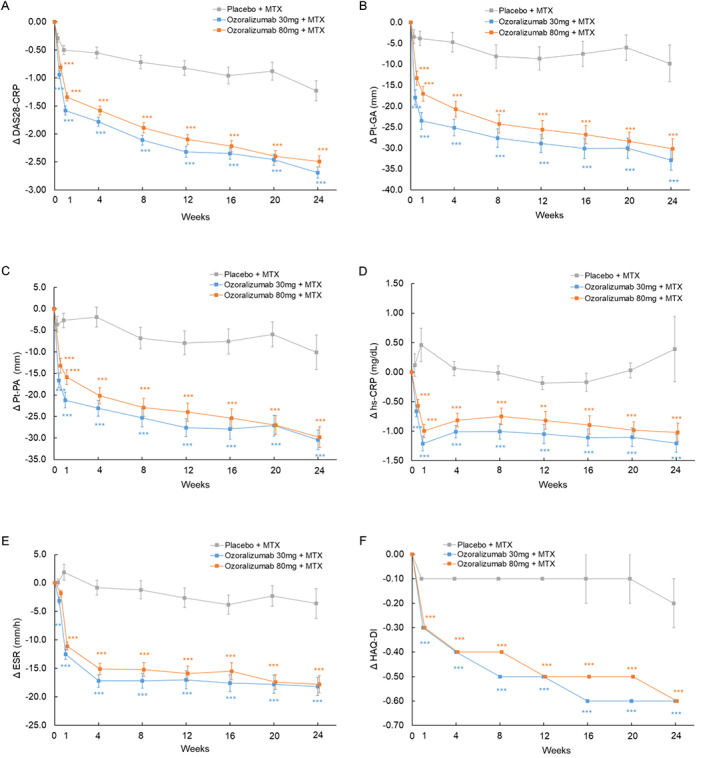
Figure 3.

Changes from baseline in various parameters over time, including change in Disease Activity Score in 28 joints using the C‐reactive protein level (DAS28‐CRP) (A), patient global assessment of disease activity (PtGA) (B), patient's assessment of pain (Pt‐PA) (C), high‐sensitivity CRP (hsCRP) level (D), erythrocyte sedimentation rate (ESR) (E), and Health Assessment Questionnaire disability index (HAQ DI) (F), from weeks 0 to 24. Statistical comparisons were determined with an analysis of covariance using the status of prior tumor necrosis factor inhibitor usage and baseline values as covariates. Symbols with error bars show the mean ± SEM. ** = P < 0.01; *** = P < 0.001 versus placebo + methotrexate (MTX).
