
Figure 2.
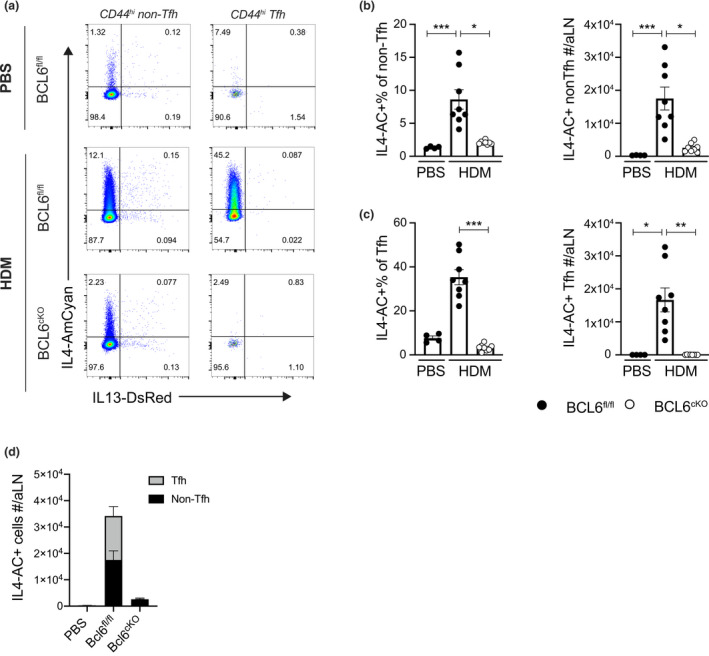
Non‐Tfh cells express reduced levels of IL4‐AC in BCL6cKO.4C13R mice. BCL6fl/fl.4C13R and BCL6cKO.4C13R mice were injected in the ear pinna with 200 μg HDM in 30 μL PBS or PBS alone and cells from the draining aLNs were harvested for analysis on day 7. (a) Flow cytometry plots depicting the expression of IL4‐AC and IL13‐DR in non‐Tfh and Tfh cells. (b, c) Frequency and total number of IL4‐AC+ non‐Tfh (b) and IL4‐AC+ Tfh cells (c). (d) Total number of IL4‐AC+ non‐Tfh and Tfh cells. Black circles represent BCL6fl/fl, white circles represent BCL6cKO samples. Data are shown as mean ± s.e.m. for six aLN per group from one of five repeats that gave similar results. *P < 0.05, **P < 0.01, ***P < 0.001, not significant is not shown. P‐values were determined using a Kruskal‐Wallis test applying Dunn's multiple comparison post‐test.