
Figure 3.
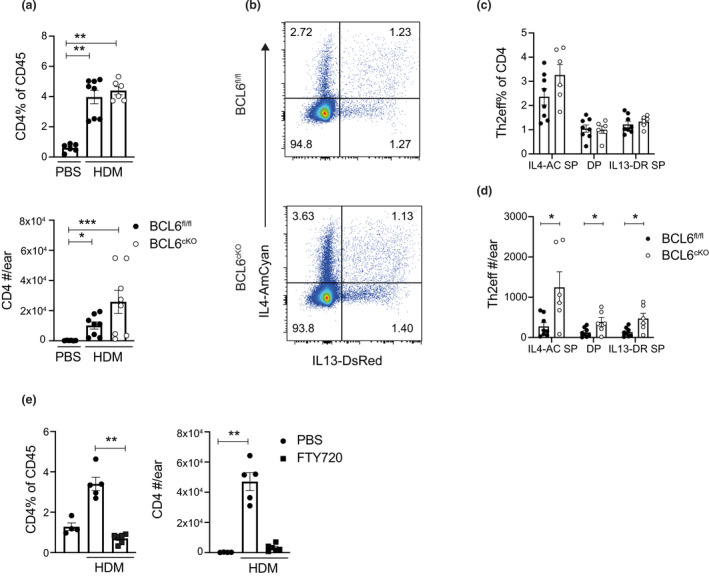
Skin Th2eff develop independently of Tfh cells. Mice were sensitized with injected in the ear pinna with 200 μg HDM in 30 μL PBS or PBS alone. Ear skin tissue was collected for analysis on day 7. (a) Frequency and total number of CD4 T cells in ear tissue from BCL6fl/fl.4C13R and BCL6cKO.4C13R mice. (b) Flow cytometry plots depicting the expression of IL4‐AC and IL13‐DR in CD4 T cells from BCL6fl/fl.4C13R and BCL6cKO.4C13R mice. (c) Enumerated frequencies and (d) total number of Th2eff cell subsets from BCL6fl/fl.4C13R and BCL6cKO.4C13R mice. (e) Frequency and total number of CD4 T cells from C57Bl/6J naïve control mice and mice that were injected with 25 μg FTY720 in PBS or PBS alone on days 2 and 4 post HDM sensitization. Black circles represent BCL6fl/fl, white circles represent BCL6cKO samples. Data are shown as mean ± s.e.m. for six ears per group from one of five repeats that gave similar results. *P < 0.05, **P < 0.01, ***P < 0.001. P‐values for a and e were determined using a Kruskal‐Wallis test applying Dunn's multiple comparison post‐test. P‐values for c and d were determined using a Mann–Whitney U‐test, independently for each Th2eff subset.