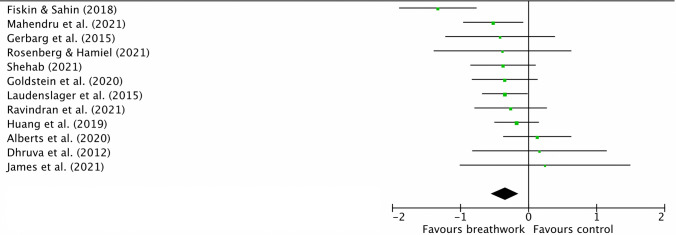
Figure 3.
Forest plot comparing breathwork interventions to non-breathwork control groups on primary outcome of self-reported/subjective stress at post-intervention. Squares and their size represent individual studies and their weight, respectively. Lines through squares are 95% CIs and diamond is the overall effect size with 95% CIs. More negative values denote larger effect of breathwork on self-reported/subjective stress in comparison to control condition. Effect sizes calculated using Hedges’ g. Figure produced using RevMan v5.4.

