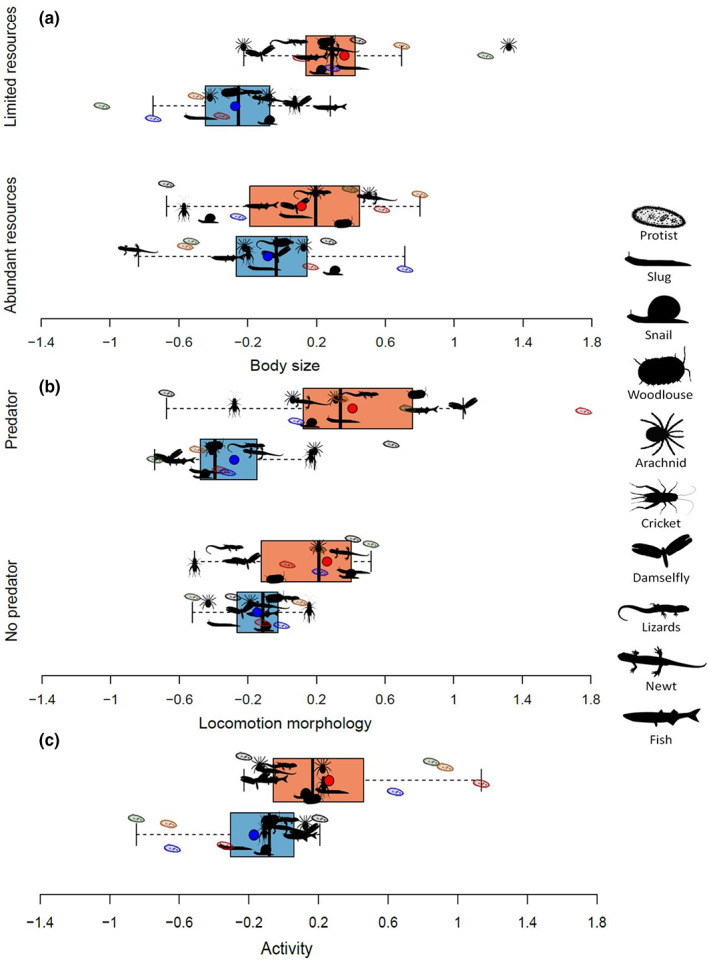
FIGURE 2.

Dispersal syndrome conditional to environmental context. (a) Size dispersal syndrome according to resource availability. (b) Locomotion morphology dispersal syndrome according to predation risk. (c) Activity dispersal syndrome. Horizontal boxplots for dispersers (light red bars) and residents (light blue bars) are built from the mean traits for each species and the mean trait value (dark red and dark blue dots) are shown. To isolate the phenotypic differences between dispersers and residents, we used residuals of a model controlling for resource and predation treatments as fixed effects and population identity nested within experimental block within species within taxon as a random intercept, but not for dispersal status and its interaction with resources and predation treatments. The colours of protist pictograms represent different species (black: Colpidium sp., red: Dexiostoma sp., orange: Tetrahymena thermophila, blue: Tetrahymena elliotti, green: Tetrahymena pyriformis).
