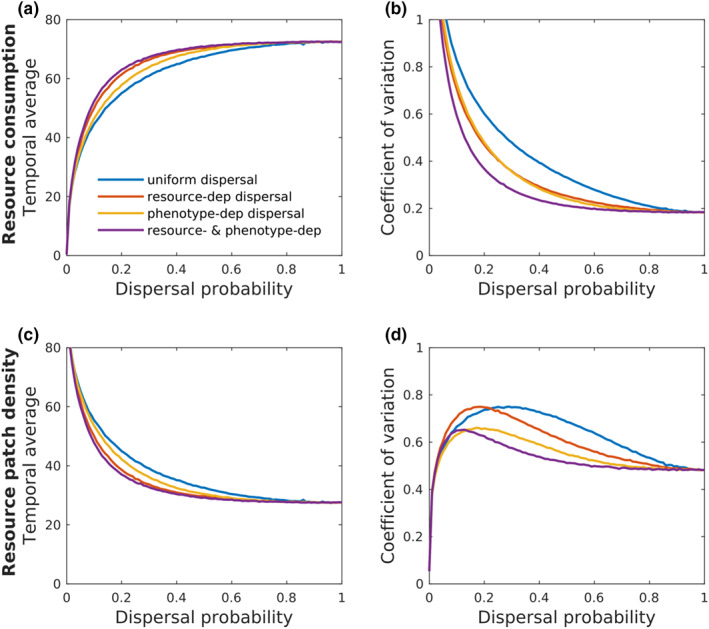
FIGURE 4.

Theoretical illustration of resource consumption and density in relation to consumers' dispersal dependencies. The dispersal of consumers was either independent of individual consumption rate and patch resource density (blue line, ‘uniform dispersal’) or positively covaried with patch resource density (orange line, ‘resource‐dep dispersal’), individual consumption rate (yellow line, ‘phenotype‐dep dispersal’), or both (purple line, ‘resource & phenotype‐dep dispersal’). Response variables are shown as the temporal average and coefficient of temporal variation of patches resource consumption (a & b respectively) and resource patch density (c & d respectively).
