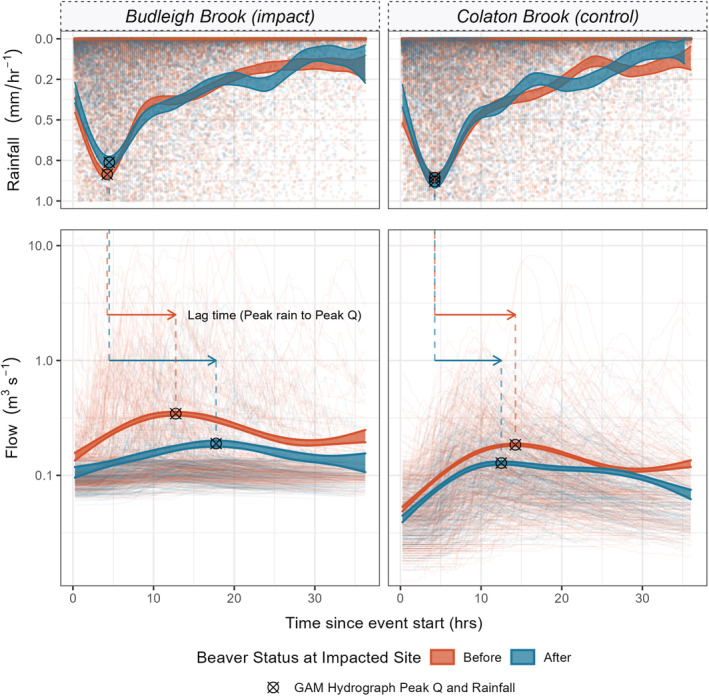
FIGURE 3.

The 95% confidence limits of the general additive model (GAM) hydrographs are presented as the shaded ribbons; individual rainfall records are presented as points and individual event hydrographs are presented as lines. The plot enables semi‐quantitative assessment of changes in average hydrograph response following beaver dam complex construction. Average event peaks are shown as crosses; these demonstrate that an increase in lag times has occurred at the impacted site whilst a slight decrease in lag times occurred at the control
