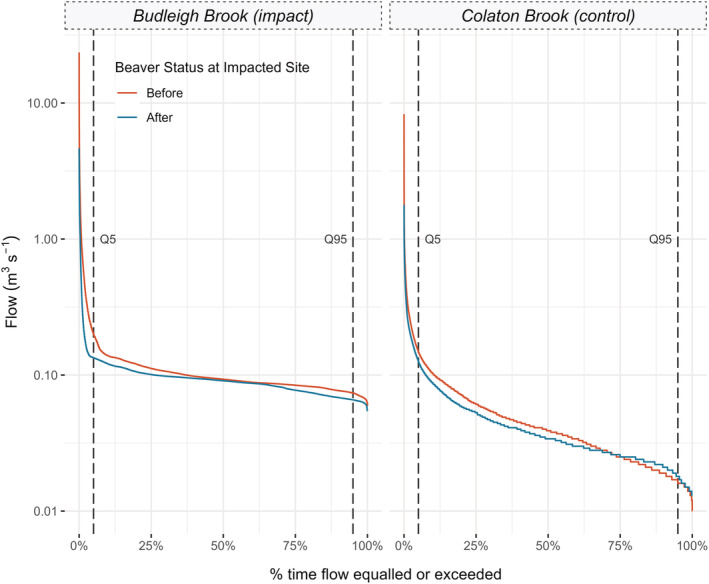
FIGURE 4.

Flow duration curves (FDC) for Budleigh and Colaton Brook. These plots represent the proportion of time that a given flow is equalled or exceeded. Q5 and Q95 lines indicate the proportion of time the flow was greater or equal to the 95th and 5th flow percentiles, respectively
