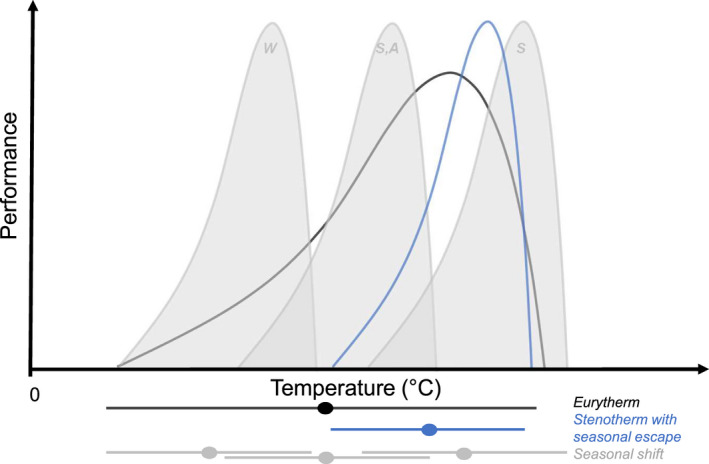
FIGURE 3.

Three generalised strategies to cope with annual temperature variability expressed as thermal performance curves (TPCs): (i) black line—eurytherm, (ii) blue line—stenotherm with seasonal escape, and (iii) grey lines—seasonal shift in TPC shown for winter (W), spring and autumn (S‐A), and summer (S). Horizontal lines below the graph show the temperatures at which an organism is active under the three strategies, as well as the seasonal shift in TPC strategy for the different seasons.
