
FIGURE 1.
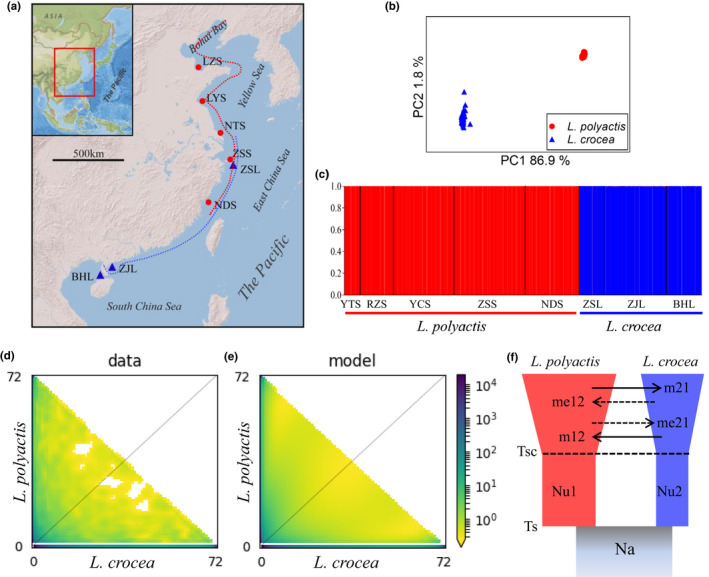
Population structure and demographic history between L. polyactis and L. crocea. (a) Sampling locations of L. polyactis (five, red circles) and L. crocea (three, blue triangles) along coastal waters of the Northwest Pacific, where the distribution range of L. polyactis and L. crocea are indicated with red and blue dashed lines, respectively. (b) Principal component analysis (PCA) of population structure between L. polyactis and L. crocea, based on common SNP data set. (c) Genetic clusters showing population structure between L. polyactis and L. crocea, based on common SNP data; (d) and (e) showing the folded joint site frequency spectrum (SFS) and the expected folded joint SFS under the most fitting demographic scenario (SC2N2mG), respectively, between L. polyactis and L. crocea. (f) The SC2N2mG demographic scenario between L. polyactis and L. crocea. Na indicates effective population size of ancestral population; Nu1 and Nu2 indicate the effective population size of the L. polyactis and L. crocea lineages after split from their common ancestral population, respectively; m12 and m21 indicate the homozygous gene flow, while me12 and me21 indicate heterozygous gene flow from one species to the counterpart; TS denotes the split time of ancestral population and TSC is the time when ancient isolation stops.