
FIGURE 4.
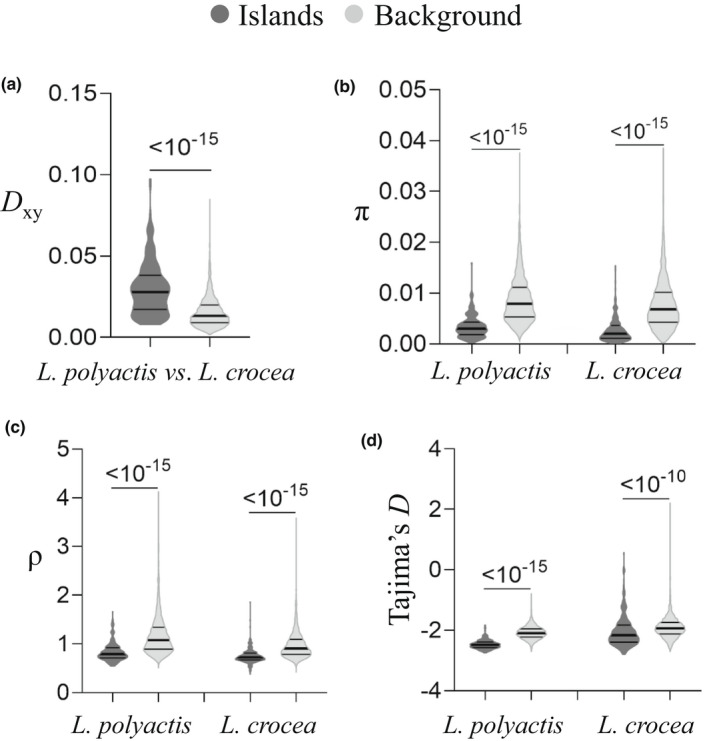
Genome‐wide heterogeneous divergence between L. polyactis and L. crocea. (a–d) show the comparisons of absolute sequence divergence (D xy), nucleotide diversity (π), recombination rate (ρ) and Tajima's D between genomic islands and the rest of the genome for interspecific divergence between L. polyactis and L. crocea, respectively, where p‐values for Mann–Whitney U tests are indicated above the plots.