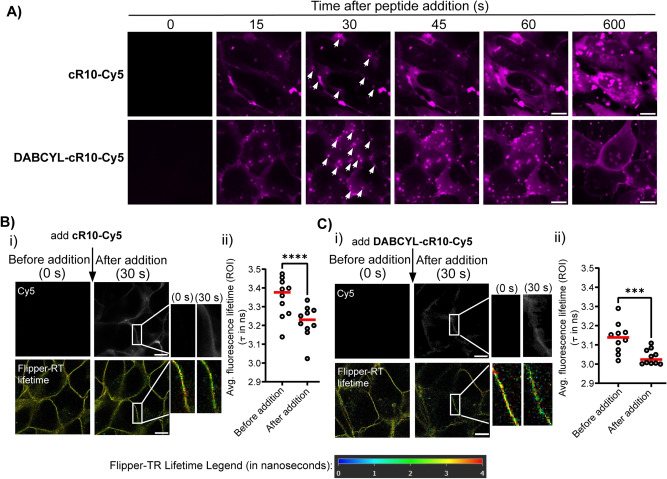
Figure 1.
A) Time‐lapse microscopy images of U2OS cells treated with 500 nM cR10‐Cy5 or DABCYL‐cR10‐Cy5. Images were taken at 15 s intervals. White arrows indicate nucleation zones. B), C) Fluorescence lifetime imaging microscopy (FLIM) images of U2OS cells before and after the addition of B) cR10‐Cy5 and C) DABCYL‐cR10‐Cy5. (i) upper panel represents Cy5 photon count and lower panels shows FastFLIM images. Scale bar=10 μm. (ii) Graphs showing the fluorescence lifetime (τ in ns) of 10 nucleation zones across three biological replicates. Red line indicates the mean τ. Statistical significance was determined by Student's t‐test. (***, P<0.001; ****, P<0.0001).

