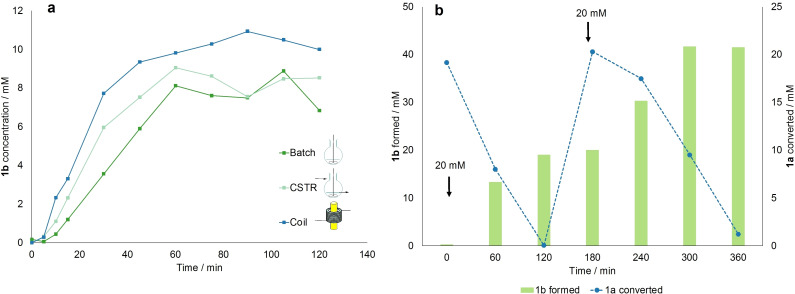
Figure 5.
(a) Comparison of the progress curves for the experiments carried out in different reactor geometries. Starting concentration of 1 a 10 mm, 300 μmol m−2 s−1, and 3.6 gCDW L−1 cell density. Single measurements. (b) Amount of 1 a converted (blue line) and 1 b formed (green bars) measured over 6 h during a double substrate feeding experiment, where 20 mm of 1 a are initially supplied to the system and subsequently fed again after 3 h. Single measurements.

