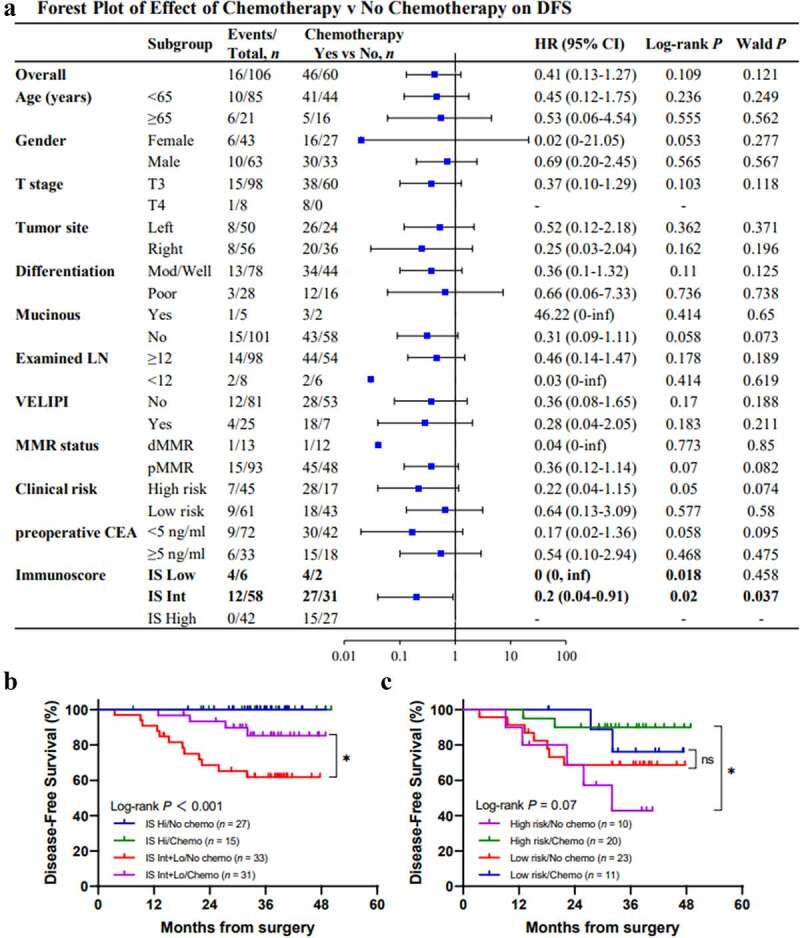
Figure 3.

Immunoscore (IS) and the benefit from adjuvant chemotherapy. Forest plot representing the predictive value of response to chemotherapy (disease-free survival [DFS]) in different groups according to clinical parameters and IS levels (a). Kaplan-Meier curves for DFS in patients with or without chemotherapy in different IS groups (b). Kaplan-Meier curves for DFS in patients with IS-Int+Low stratified by clinical risk and chemotherapy (c). (*) indicates significant log-rank P-value, *P < .05; ns, non-significant.
