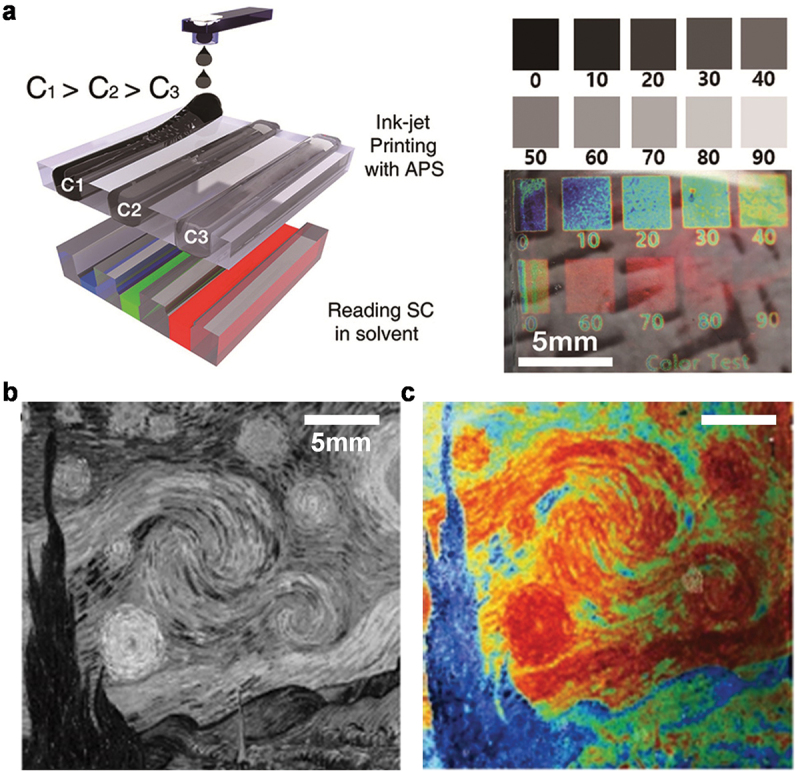
Figure 4.

(a) (left) Schematic of a printable APS ink in the cartridge of a modified inkjet printer with different APS concentrations C1, C2, and C3. the APS concentration increases in the order of C1, C2, and C3 (C1 < C2 < C3). (right) a black and white contrast for regulating APS concentration in a specific area. Photographs of the inkjet-printed BCP SCs at corresponding contrast when immersed in ethanol. A low contrast number representing a high APS concentration. (b) Black and white contrast image converted by computer software. (c) Resulting BCP SC image printed by APS ink when immersed in ethanol. Reproduced with permission [44]. Copyright 2017, Wiley-VCH.
