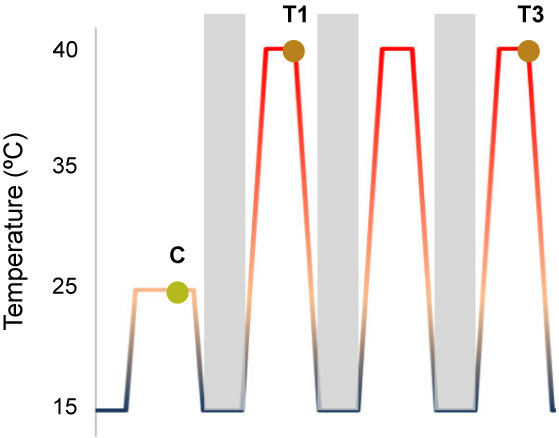
Figure 1.

RNA‐seq experimental design. Temperature ranks from 15°C to 25°C in control conditions and to 40°C in stress conditions. Plants were stressed and sampled on day 1 (T1) and day 3 (T3) to characterize short and medium responses. Then, RNA extracted from treated plants was sequenced in order to perform splicing analysis. C, Control; T1 and T3, plant samples after 1 or 3 days of stress.
