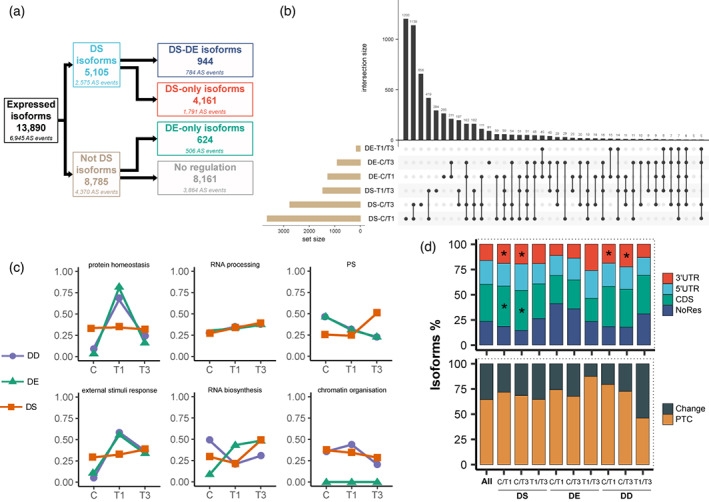
Figure 2.

Summary of alternative splicing events and differential expression analysis of the P. radiata response to high temperature. (a) Flow chart showing the distribution of the 5105 DS and 1568 DE isoforms detected. DS, differential splicing; DE, differential expression; DD, double differential. (b) Matrix layout for all intersections of DS and DE comparisons, sorted by decreasing number of isoforms. Dark circles in the matrix indicate sets that are part of the intersection. C/T1, C versus T1 comparison; C/T3, C versus T3 comparison; T1/T3, T1 versus T3 comparison. (c) Differential expression trends as determined using Mercator4 categorization terms. The numbers indicate scaled expression according to the Mercator4 functional bin. (d) The distribution of distinct types of AS events by differential level and comparison. From bottom to top, 100% refers to all CDS AS events and all AS events. Change, make protein sequence changes; NoRes, neither full models nor full transcript sequences were predicted/mapped so events could not be classified. Significant enrichments are marked with ‘*’. The sampling times correspond to the 40°C assay shown in Figure 1.
