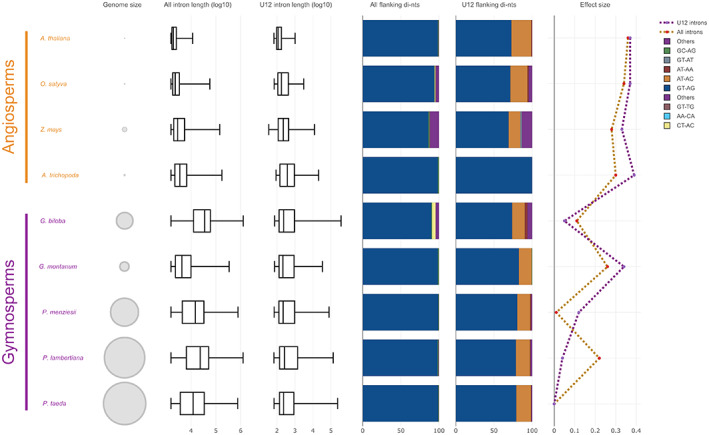
Figure 3.

Comparative analysis of intron morphologies. Nine representative seed plants species were included: A. thaliana, Arabidopsis thaliana; O. sativa, Oryza sativa; Z. mays, Zea mays; A. trichopoda, Amborella trichopoda; G. biloba, Ginkgo biloba; G. montanum, Gnetum montanum; P. menziesii, Pseudotsuga menziesii; P. lambertiana, Pinus lambertiana; P. taeda, Pinus taeda. For all isoforms of each species we computed (from left to right): genome size (bp, scaled to the P. taeda genome), the all‐intron length distribution, the U12 intron length distribution, the all‐intron flanking di‐nt proportions, the U12 intron flanking di‐nt proportions, and the all‐intron/U12 intron length effect size, using P. taeda as reference. Different colors in flanking di‐nt proportion bar plots indicate distinct types of di‐nts. Gold and purple in effect size line plots indicate all introns and U12 introns, respectively.
