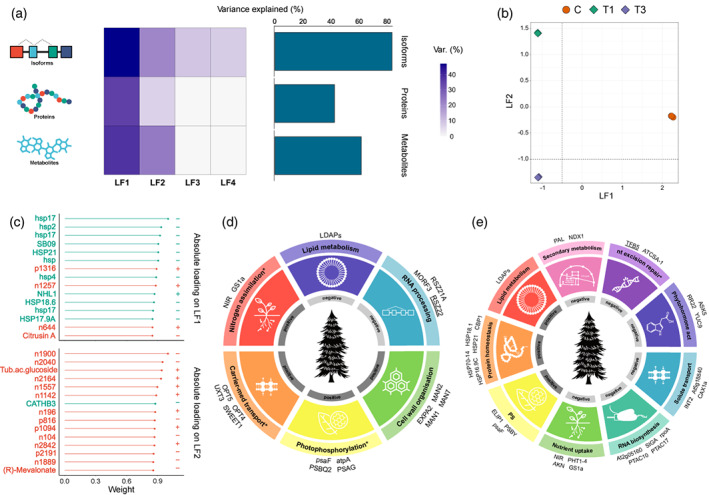
Figure 5.

Relative contributions of distinct regulatory layers to the definition of the heat response. (a) Percentage of variance explained (R 2) by each MOFA2 factor (columns) across regulatory layers (rows) (left panel). Total contributions of each layer are summarized in the bar plot (right panel). (b) Scatter plot of latent factor 1 (x‐axis) and latent factor 2 (y‐axis) illustrating the variation described. Samples are colored according to treatment (C, T1, T3). (c) Lollipop plots showing top loading latent factor 1 (top) and latent factor 2 (bottom) features in descending order. Red and green indicate metabolome and proteome features, respectively. The sampling times correspond to the 40°C assay shown in Figure 1. (d,e) Enriched Mercator4 functional categories and top weight isoforms associated with latent factor 1 (e) and latent factor 2 (d). Functional categories marked with ‘*’ were renamed to subterms as follows because all top weight isoforms displayed belong to the same Mercator4 functional subterm: PS > photophosphorylation, solute transport > carrier‐mediated transport, nutrient uptake > nitrogen assimilation, DNA damage response > nucleotide excision repair. Positive, functional terms linked to samples with scores of >0; Negative, functional terms linked to samples with scores of <0.
