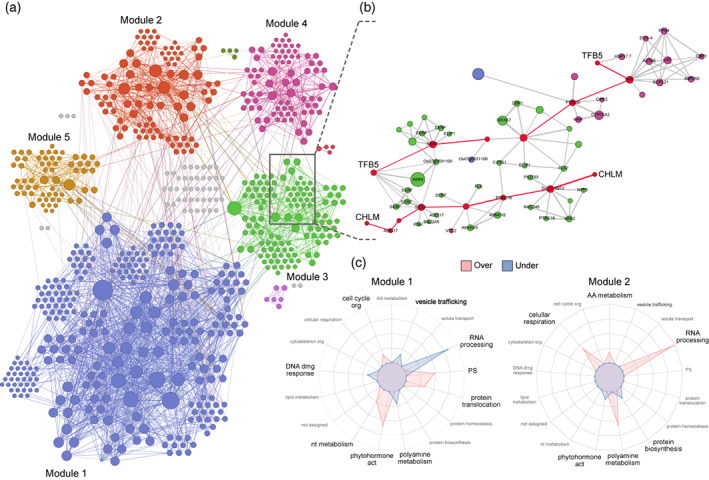
Figure 6.

Meta‐network regulatory analysis. (a) Meta‐network constituted by five highly connected modules (different colors). Nodes represent isoforms and node size reflects Katz centrality. Network edges indicate biological interactions. (b) Local interaction network connecting both isoforms from two AS events. Nodes and edges highlighted in red illustrate the shortest path between intra‐event isoforms. (c) Radar plots showing topology enrichment (red) and reduction (blue) of Mercator4 functional terms for the two biggest modules of the meta‐network. Peak size = −log10(adjusted P).
