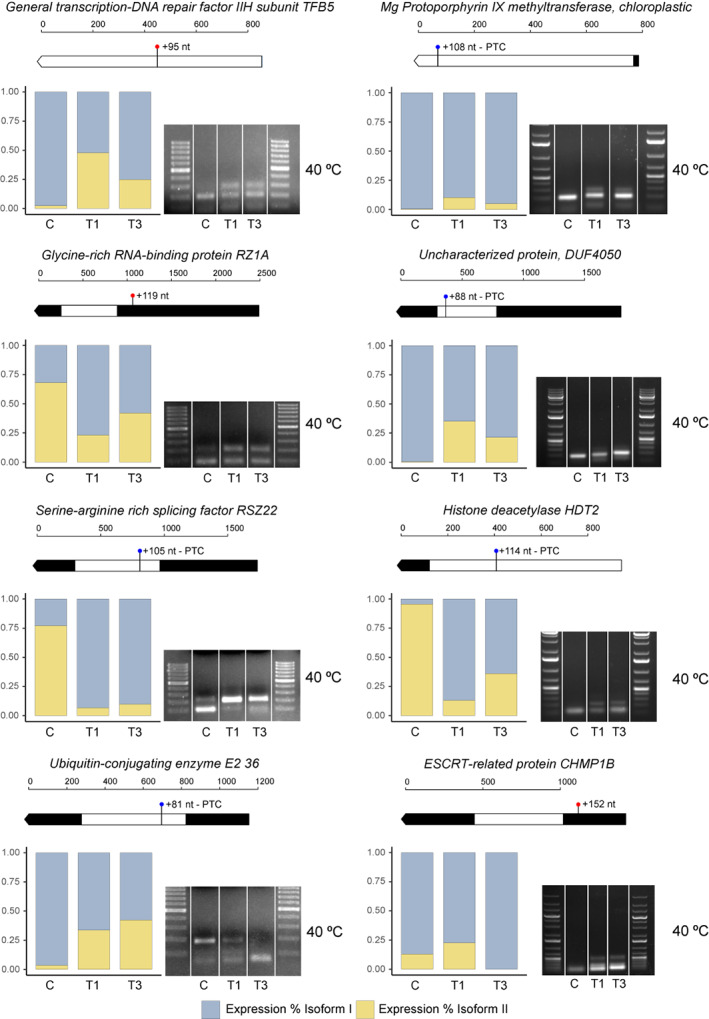
Figure 7.

Experimental validation of heat‐induced AS events by RT‐PCR. Each AS event is represented by a block constituted by two panels. Top panel: transcript models of the small isoform displaying event length, PTC introduction, and where the variation is produced. Bottom left and bottom right panels: bar plots showing relative expression of isoform 1 (blue) and isoform 2 (yellow) of AS events revealed by RNA‐seq and RT‐PCR AS patterns at the sampling times corresponding to the 40°C assay shown in Figure 1. The primers used allow the amplification of both splice variants.
