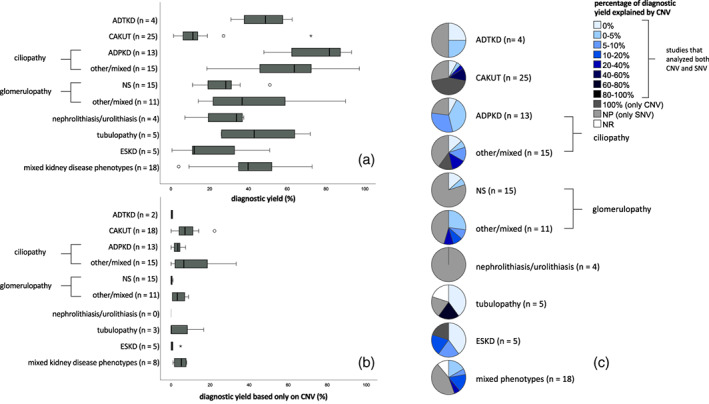
FIGURE 1.

Diagnostic yield across disease categories. (a) Diagnostic yield per disease category. Subdivision of the specific phenotypes within the “mixed kidney disease phenotypes” group is not added up to the corresponding separate disease groups since patient/test/cohort characteristics are not available per phenotype within the studies in this group. Between brackets the number of included studies. (b) Diagnostic yield based only on copy number variation (CNV) detection. Between brackets the number of studies that performed CNV analysis. (c) Percentage of overall diagnostic yield (a) explained by CNVs (b). Between brackets the total number of studies. This is a ratio between subpanels (b) and (a), showing how much CNV testing contributed to the diagnostic yield per study.
