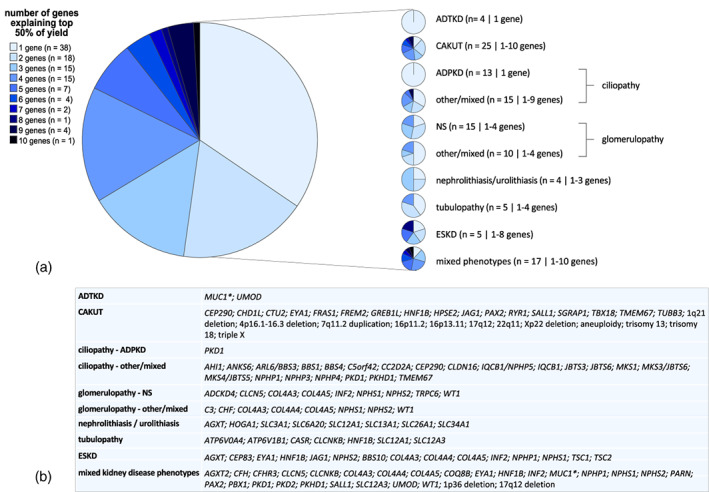
FIGURE 5.

Top 50% of diagnostic yield explained by limited number of genes and/or copy number variations (CNVs). (a) Pie charts visualizing number of genes responsible for top 50% of yield. The legend on the left describes for each category in the pie chart, the number of studies identified with this number of genes. In between brackets on the right are the number of studies that reported on top 50% causal genes and separated by “|” the number of genes responsible for the top 50% for that specific phenotype. (b) The genes that made up this ~50% in each study per phenotype group are displayed here, unless genes were responsible for only one positive case and/or multiple genes made up for the final percentages. * Variants in the large variable number tandem repeats region of MUC1 are usually missed by massively parallel sequencing.
