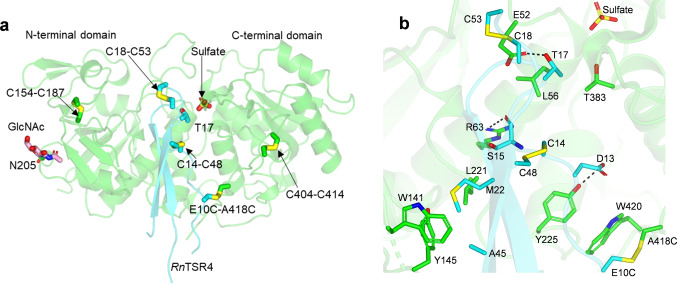
Figure 2.
a) Cartoon representation of the complex. CePoFUT2A418C and RnTSR4E10C are shown in green and cyan, respectively. Disulfide bridges are indicated in yellow. Carbon atoms of the GlcNAc moiety covalently bound to Asn205 are shown in pink. A sulfate molecule and the acceptor Thr17 of RnTSR4E10C are also shown in the active site. b) Close‐up view of the few direct interactions in the complex. H‐bond interactions are shown as dotted black lines.

