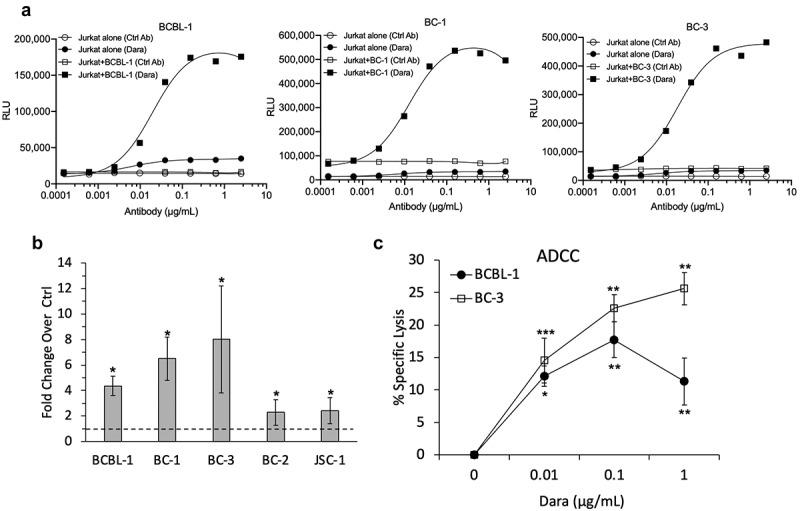
Figure 4.

Dara-induced ADCC of PEL cell lines. (a) ADCC induction by Dara was assessed using Jurkat-ADCC cells (expressing FcY receptor and luciferase-driven NFAT response element) as the effector cells. BCBL-1, BC-1, or BC-3 cells were treated with various concentrations of Dara or human IgG isotype control ab and co-incubated with Jurkat-ADCC cells; luciferase activity was measured after 6 h. Data are presented as relative luminescence unit (RLU) from Jurkat-ADCC cells alone or Jurkat-ADCC cells co-incubated with PEL cells in the presence or absence of Dara from one representative experiment. (b) ADCC pathway activation in Jurkat-ADCC cells by 0.6 ug/mL Dara-treated PEL cell lines presented as fold change in luciferase activity over control-treated cells. Data represent an average from 3 independent experiments (4 experiments for BC-3) and error bars represent standard deviations. (c) PBMC-mediated ADCC of BCBL-1 and BC-3 cells as measured by calcein-AM release assay. Percent specific lysis was calculated by subtracting the % lysis in the absence of Dara from that in its presence. Data represent an average of 4 (BCBL-1) or 3 (BC-3) separate experiments and error bars represent standard deviations. Statistically significant differences (*P ≤ .05, **P ≤ .01, ***P ≤ .001) relative to controls without Dara as calculated using 2-tailed t-test are indicated.
