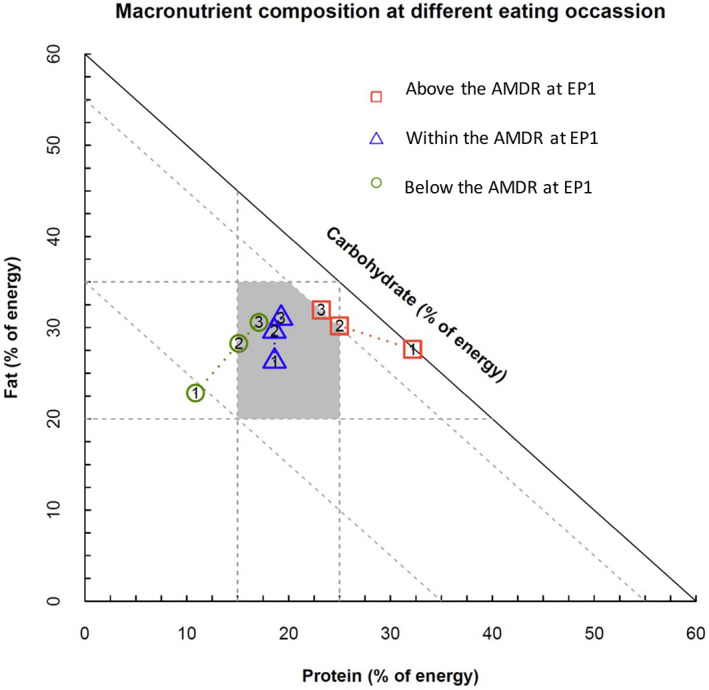
FIGURE 1.

Cumulative proportion of macronutrients from Eating Period 1 (EP1) to EP3 by reported protein density below, within, or above the AMDR at EP1. The day was divided into three intervals; EP1 between midnight and 11 am; EP2 between 11:00 am and 4:00 pm; and EP3 after 4:00 pm, indicated as 1, 2, 3 on the figure. Positions at 3 indicate the macronutrient proportions over the day, that is, from the start of the day to the end of the day. Shaded polygon area: Acceptable Macronutrient Distribution Range (AMDR) for Australians and New Zealanders [Color figure can be viewed at wileyonlinelibrary.com]
