
FIGURE 2.
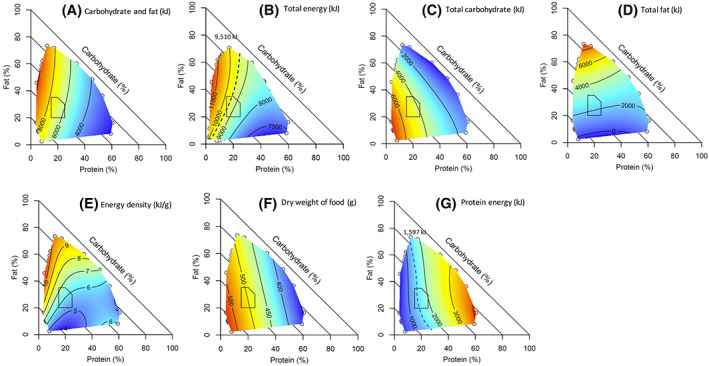
Surface plots showing the relationship between daily dietary macronutrient distributions and energy intake from different dietary components for adults. (A) Carbohydrates and fat (kJ). (B) Total energy (kJ). (C) Total carbohydrates (kJ). (D) Total fat (kJ). (E) Energy density (kJ/g). (F) Dry weight of food (g). (G) Protein energy (kJ). For any point on the colored surface, the point represents the average energy for that contribution of protein (%E), fat (%E), and carbohydrates (%E) from the dietary component. As percentage energy from protein increases along the x axis, total energy decreases (red to blue), and total protein increases (blue to red). Carbohydrates (%E) are deterministically implied as the proportion from macronutrients = 100%, and the value is shown as diagonal lines with slope = −1. The polygon represents the Australian/New Zealand Acceptable Macronutrient Distribution Range (AMDR). The dashed line in panel (B) represents the estimated energy requirements based on the basal metabolic rate of the average adult from the survey assuming equilibrium and a physical activity level of 1.4 (9510 kJ); the data indicate that diets within 15%–20% energy from protein correspond to equilibrium energy intake, whereas dietary protein densities below and above this level are associated with positive and negative energy balance, respectively. The dashed contour in panel (F) represents an approximate average protein requirement for the survey population (1597 kJ), based on an average person's weight of 78.3 kg (95% CI: 77.8–78.8) and the maximum population‐safe requirements estimated by Elango et al. (1.2 g/kg) [18] [Color figure can be viewed at wileyonlinelibrary.com]