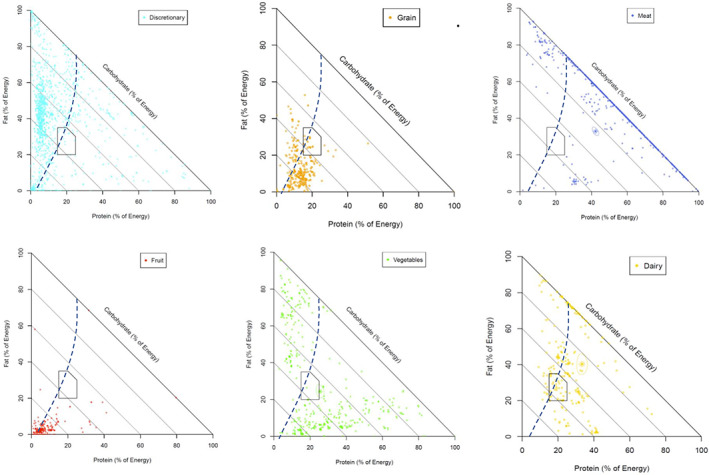
FIGURE 3.

Macronutrient composition for discretionary foods and the five food groups. Percentage energy from protein, carbohydrates, and fat for discretionary foods and the five food groups as consumed by participants in the National Nutrition and Physical Activity Survey (2011–2012) including from left to right, top to bottom: discretionary foods; grains and cereals; meat including poultry, fish, eggs, tofu, nuts, seeds, legumes, and beans; fruit; vegetables; and dairy products including milk, yogurt, cheese, and/or alternatives. The circled data points indicate the mean nutrient composition of the food group. The dashed line represents the estimated energy requirements based on the basal metabolic rate ratio of the average adult from the NNPAS assuming equilibrium and a physical activity level of 1.4 (9510 kJ). Polygon area: Acceptable Macronutrient Distribution Range (AMDR) for Australians and New Zealanders [Color figure can be viewed at wileyonlinelibrary.com]
