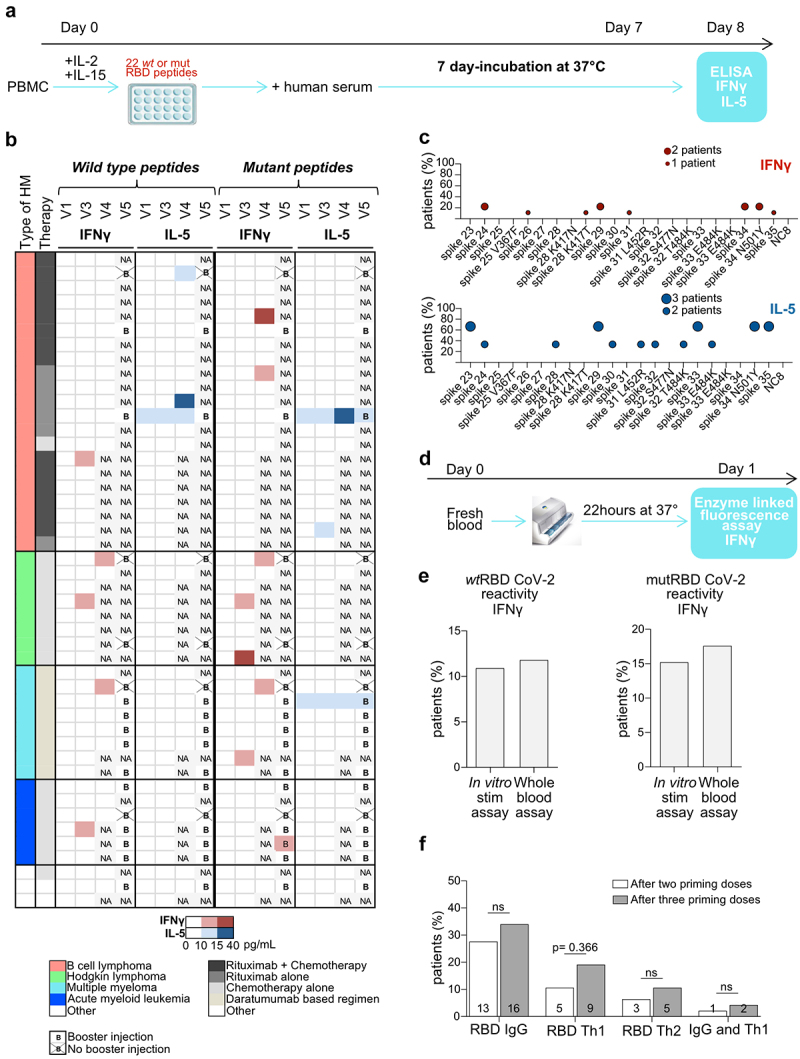
Figure 2.

T cell responses after BNT162b2 injections in patients with HM. a. Experimental setting for the in vitro stimulation (IVS) assay based on 22 peptides. b. Heatmap representing cytokine release (IFNγ (red) and IL5 (blue)) detected in IVS assay (a) from PBMC drawn at visits 1, 3, 4 and 5 and stimulated with a pool of wild-type or mutant S1-RBD peptides (Table S1). Results are shown according to HM type, therapy, time and intensity of the response (the color gradient is proportional to the quantity of IFNγ or IL-5 release). c. Idem as in B but showing the reactivity to single peptide contained in the pool as a percentage of reactive patients who developed a S1-RBD specific IFNγ (red) or IL-5 (blue) cytokine release for wild-type and mutant epitopes. d. Experimental setting for the whole-blood automatic stimulation assay. e. Head-on comparison of paired specimen analyzed with the classical (A) or the automatic Vidas assay (d). The percentage of patients who developed IFNγ reactivity to wild-type and mutant peptides using the two different techniques is depicted. The threshold for IFNγ positivity is ≥ 10 pg/mL for in vitro stimulation assay and ≥ 0.08 UI/mL for whole blood assay. f. Analysis of the effects of the booster on humoral and cellular immune responses directed against S1-RBD, by the percentages of positive patients. Student t-test or ANOVA Fischer exact method.
