
Figure 1.
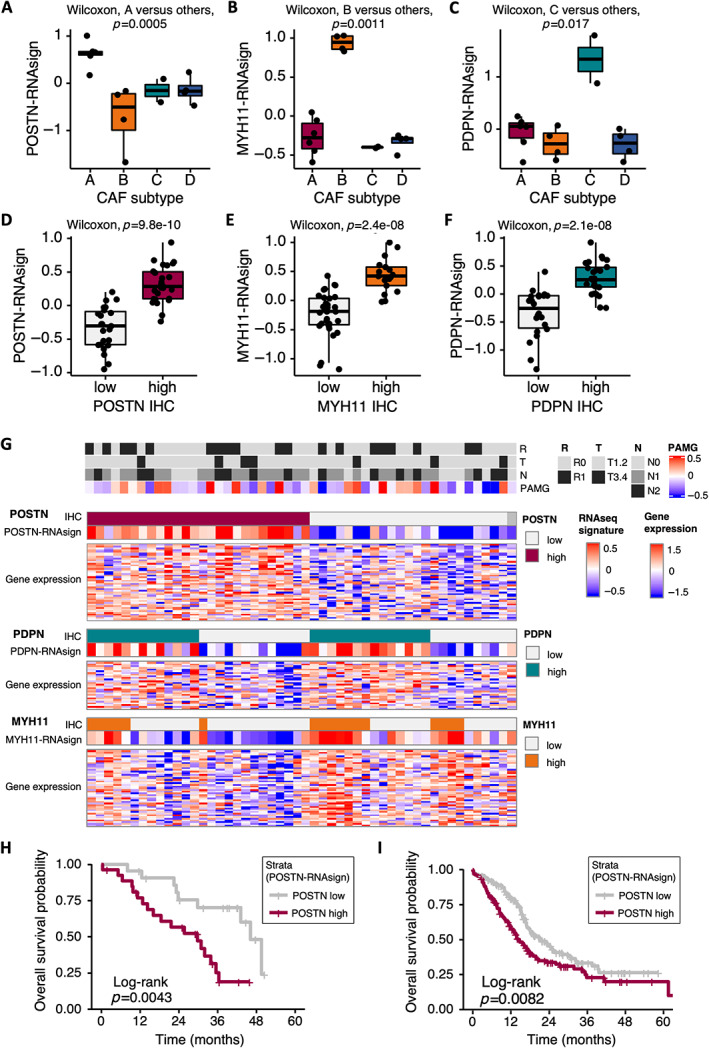
Pancreatic ductal adenocarcinoma (PDAC) cancer‐associated fibroblast (CAF) RNAseq signatures. (A) Periostin (POSTN) multigene RNAseq signature (POSTN‐RNAsign) expression level according to CAF subtypes (A–D, pCAFassigner) in primary CAF cultures (Set 1 [10], n = 16). Subtype A is displayed in red, B in orange, C in green, and D in blue. (B) Myosin‐11 (MYH11) multigene RNAseq signature (MYH11‐RNAsign) expression level according to CAF subtypes (A–D, pCAFassigner) in primary CAF cultures (Set 1, n = 16). (C) Podoplanin (PDPN) multigene RNAseq signature (PDPN‐RNAsign) expression level according to CAF subtypes (A–D, pCAFassigner) in primary CAF cultures (Set 1, n = 16). (D) POSTN‐RNAsign expression level according to POSTN protein expression assessed by immunohistochemistry (IHC) (high in red versus low in gray) in resected human PDAC samples (Beaujon cohort, n = 50). (E) MYH11‐RNAsign expression level according to MYH11 protein expression assessed by IHC (high in orange versus low in gray) in resected human PDAC samples (Beaujon cohort, n = 50). (F) PDPN‐RNAsign expression level according to PDPN protein expression assessed by IHC (high in green versus low in gray) in resected human PDAC samples (Beaujon cohort, n = 50). (G) Heatmap showing POSTN, PDPN, and MYH11 protein expression by IHC (high versus low), multigene RNAseq signatures and gene expression, and association with tumor prognostic features, in individual patients from Beaujon cohort (n = 50). Each column represents one patient. POSTN‐high expression by IHC is displayed in red, PDPN‐high expression in green, and MYH11‐high expression in orange, with low expressions in light gray. For gene expression and signatures, higher expression is shown in red and lower expression in blue. Tumor features are displayed in the upper part of the figure: R: resection margin status (R0, no microscopic invasion, in gray and R1, presence of microscopic invasion, in black), T: TNM T‐stage (tumor) (T1‐2 in gray and T3‐4 in black), N: TNM N‐stage (lymph nodes) (N0 in gray, 1 in dark gray, N2 in black); PAMG, pancreatic adenocarcinoma molecular gradient [37] (more classical in blue, more basal‐like in red); NA, not assessable. (H) Kaplan–Meier curves for overall survival (OS) in Beaujon cohort (n = 49), according to POSTN‐RNAsign expression (high in red versus low in gray). (I) Kaplan–Meier curves for OS in International Cancer Genome Consortium (ICGC) data set (n = 267), according to POSTN‐RNAsign expression (high in red versus low in gray).